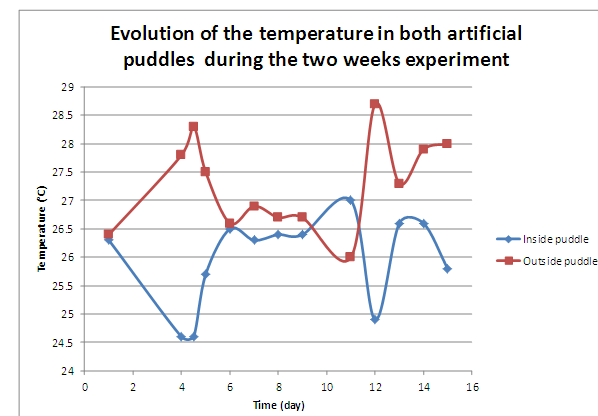
This graph shows the evolution of the temperature of two artificial puddles during two weeks.
We have measure the temperature of the inside puddle in blue and we have measure the temperature of the outside artificial puddle in red.
This graph shows the evolution of the temperature of two artificial puddles during two weeks.
We have measure the temperature of the inside puddle in blue and we have measure the temperature of the outside artificial puddle in red.